
AI Change Management
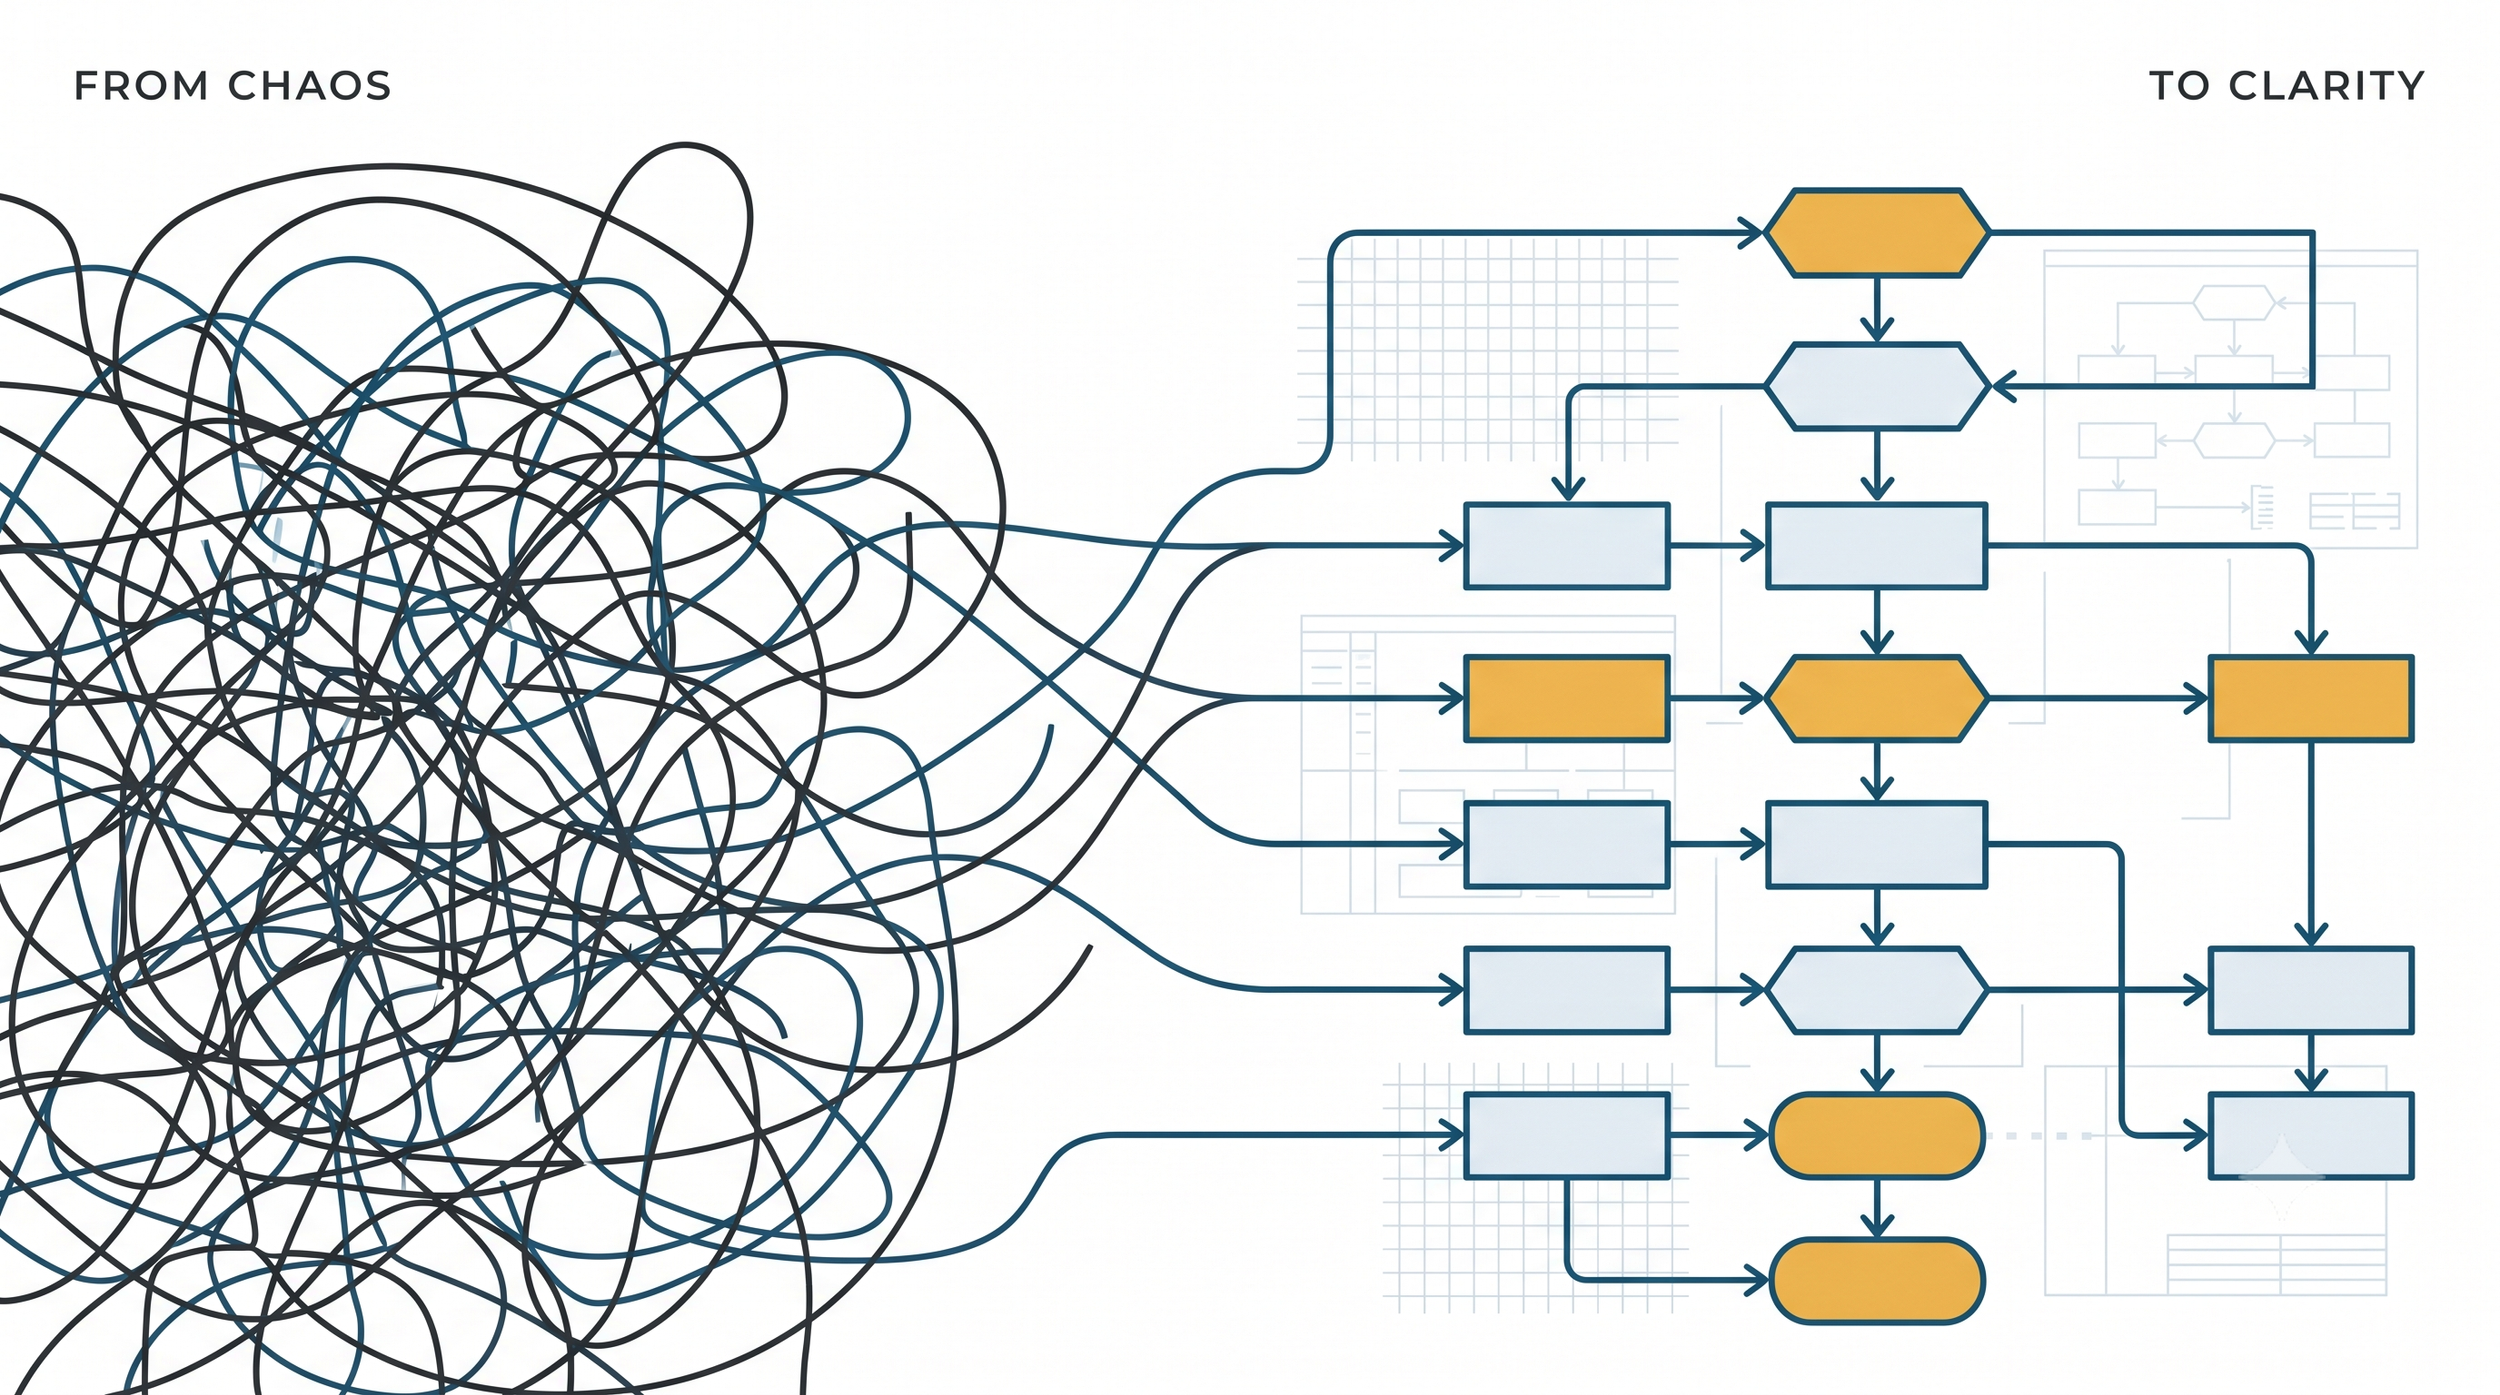
Mapping to Audit and Optimize Your Systems
According to research by Boston Consulting Group (BCG) and McKinsey, nearly 70% of digital transformation and new software initiatives fail to reach their intended goals. Additionally, a recent report by the RAND Corporation found that over 80% of AI projects fail to reach production—twice the failure rate of traditional IT projects Often, this happens because new tools—like AI—are forced into chaotic and misaglined, legacy workflows.
Documenting and regularly auditing the operational systems of your organization is the key to preventing this. In today's fast-paced health-tech environment, IT leaders face immense pressure to innovate quickly. But implementing AI without understanding the root process doesn't solve problems; it just accelerates technical debt. We recommend developing a System Map to provide a clear visual that helps diverse teams deeply understand intricate operational relationships before trying to solve them. This clarity uncovers root issues, identifies true efficiencies, and prevents building the wrong thing.
A System Map visualizes the people, relationships, and operational dynamics, helping organizations identify patterns, bottlenecks, and strategies to strengthen their processes and operations. It doesn’t have to be pretty, just functional, although if it’s visually beautiful it’s more fun to share).
The Value of a System Map
Change is hard, but stagnation is a death sentence—leading to shadow IT, unaligned and disengaged employees, outdated offerings, and weakened resilience. A System Map is a visual that helps:
Improve Collaboration: Understanding relationships and interactions can enhance alignment across siloed departments.
Identify Opportunities: Reveals hidden inefficiencies in siloed environments, enabling targeted improvements that will have greater organizational impact.
Optimize Resources: Clarifying resource flow allows for optimized allocation and usage.
Minimize Risk: Visualizing the interconnectedness between people and software allows organizations to anticipate unintended impacts during an AI rollout or major change.
Develop Operational Alignment: Co-creating this visual with process owners across your organization fosters cross-functional agreement and sets clear operational requirements.
A Health-Tech Example
Consider a health-tech company rolling out a new AI-driven Patient Scheduling Platform for hospital networks. The below are potential aspects that a System Map could visuals to allow a better understanding of the challenges and gaps in the existing system.
Process Owners & End-Users: Internal product teams, hospital administrative staff, and patients.
Delivery Partners: Cloud hosting providers and customer success teams.
Technology Platforms: API integrations with legacy EHRs and internal ticketing systems.
Regulatory Frameworks: HIPAA compliance and data privacy laws.
Each element uniquely impacts internal operations. If this health-tech company rolls out an AI scheduling feature without mapping how it interacts with the hospital's legacy EHR or the patient's actual workflow, the AI most likely won’t solve the actual root problem. They are just creating a faster way to make scheduling errors. By visualizing upstream and downstream relationships, teams can anticipate these obstacles before they become expensive technical debt.
How To Make One
First, choose your tool. We recommend Miro or Lucidchart for interactive digital diagrams, or sticky notes for a low-fi approach that can help quickly get on the same page. Then, all you have to do is follow these six steps:
1. Define Purpose
What is the objective you want to understand with this System Map? The elements that make up an organization are endless. Understanding this objective determines which people, factors, and level of detail are necessary.
2. People
Which key players have impact, influence, or participate within your operational objective? Identify all process owners and end-users within your system.
3. Systems & Services
What internal and external factors make up your system? Internal factors include current software, tools, and budget. External influences include policies, economic conditions, tech advancements, and regulatory changes.
4. Relationships
How do process owners, systems, and services interact? Look for power dynamics, dependencies, upstream/downstream impacts, and collaboration allowing you to reveal innovation and efficiency potential.
Note: When implementing AI, this step is especially critical for mapping the "invisible handoffs" between the AI agents, and the human. Understanding exactly where a human needs to verify an AI output ensures your process remains ethical, safe, and transparent.
5. Metrics
What key organizational indicators are tracked by you and others in the system? When auditing for AI, key indicators might include “effort,” “engagement,” “control,” “efficiency.” Visualizing these helps pinpoint areas needing deeper analysis.
6. Analyze & Iterate
Together with your process owners and partners, review the map, identify bottlenecks, and define clear operational requirements. Revisit regularly, and update with new data to track progress.
A System Map is one of many tools that can support organizational change. Try mapping these elements out on your own with your team. If you hit a snag or want to ensure your next technology rollout is built on a solid foundation, contact Lini today for a consultation on mapping your systems for confident, rapid growth.

This article was written by Sylvia Bargellini
She is a creator of innovative human-centric products and services that enhance emerging technology process efficiencies, experiences and profits by identifying unique creative business opportunities. With over a decade of industry knowledge Sylvia guides interdisciplinary teams towards effective product optimization.