
Optimize IT Processes by ~25%
Through Strategic Visual Mapping and Stakeholder Alignment
Healthcare, IT
Client IndustryIT Process Optimization, Ecosystem Mapping, Stakeholder Workshop Facilitation, Activation Planning
Services ProvidedReduced IT process friction by ~25%: increased project completion speed, streamlined ticketing process to reduce shadow IT, prioritization of where/how efforts were spent
Successfully aligned IT leadership with 25 cross-functional organizational team leaders and executives
Equipped the IT team with new capabilities and a reusable "Process Book" to independently manage future initiatives
Key ResultsChallenge + Approach
The American Academy of Ophthalmology (AAO) IT team was bogged down by unstructured requests and relentless scope creep.
Internal stakeholders (e.g, Marketing, Operations, Customer Success) frequently bypassed IT altogether, leading to unauthorized "shadow IT" initiatives. When projects were formally submitted, they often lacked defined parameters, causing project scopes to balloon unchecked as work progressed.
This chaotic environment created severe bottlenecks, frustrated both IT and cross-functional teams, and highlighted the urgent need for a unified, transparent way to manage project intake and collaboration.
01
EVALUATE
Ecosystem Map
02
GENERATE
Stakeholder Collaboration
03
ACTIVATE
Implementation Plan
Sound similar to your situation?
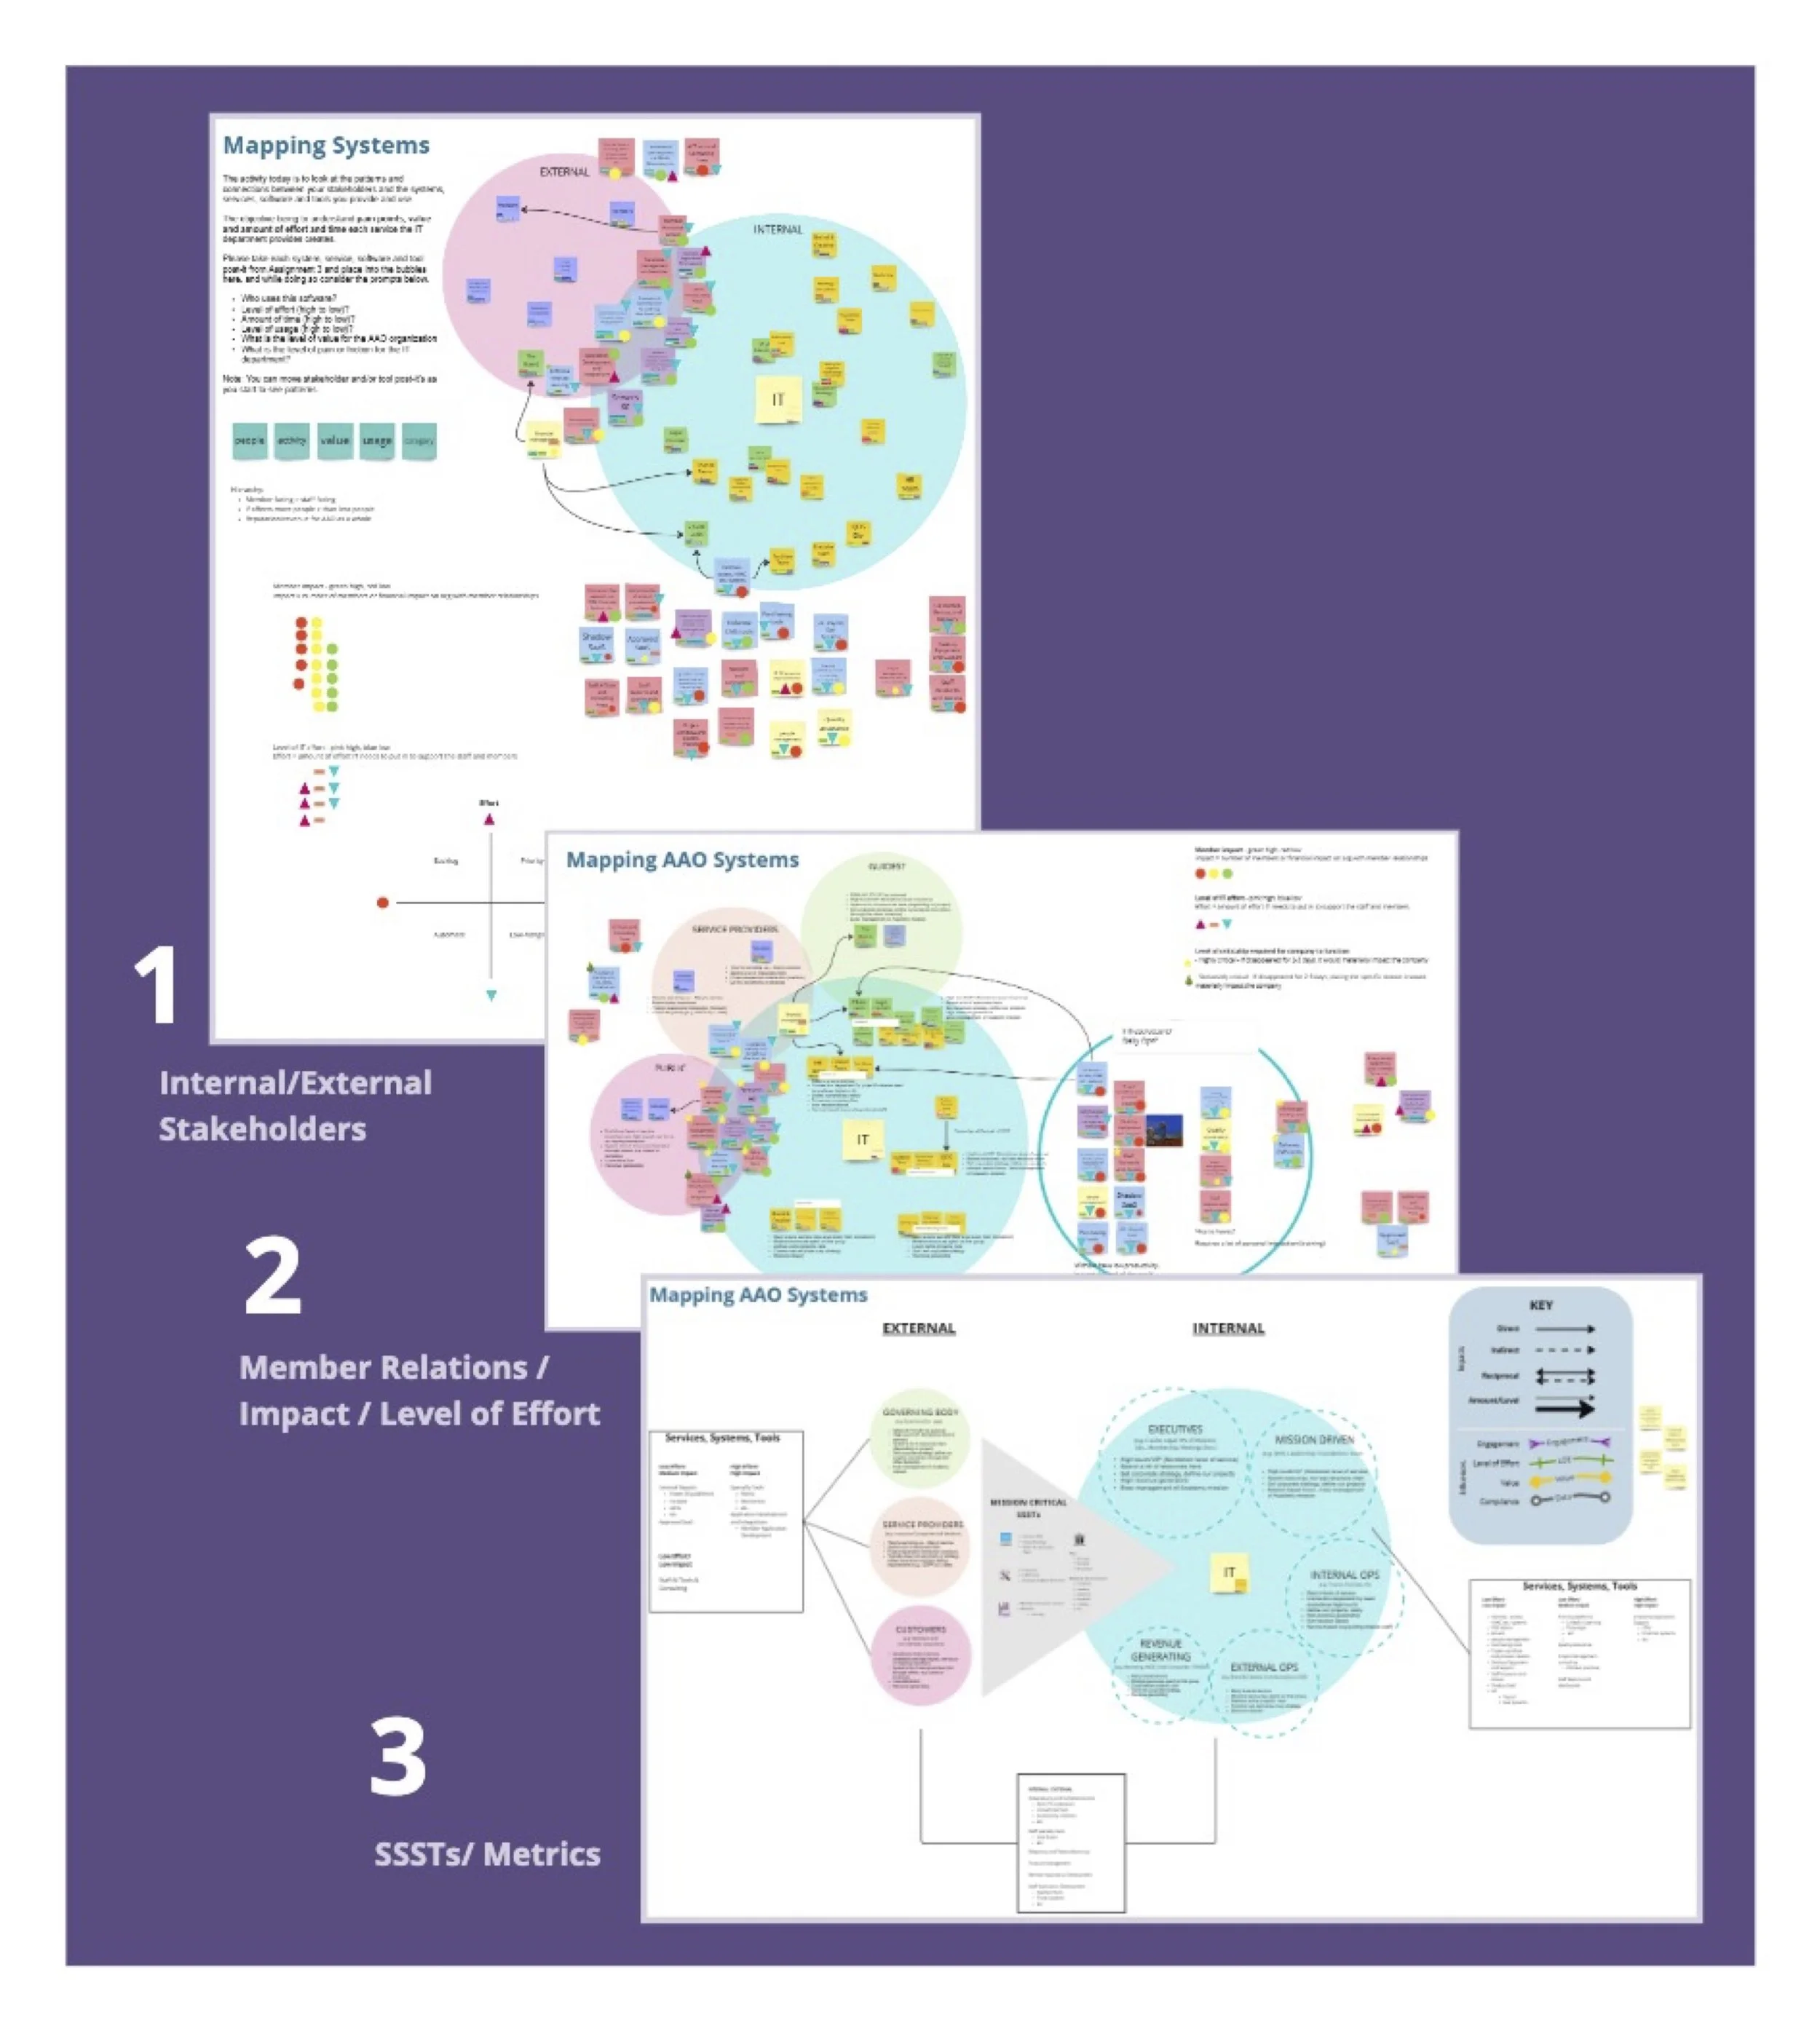
EVALUATE Environment:
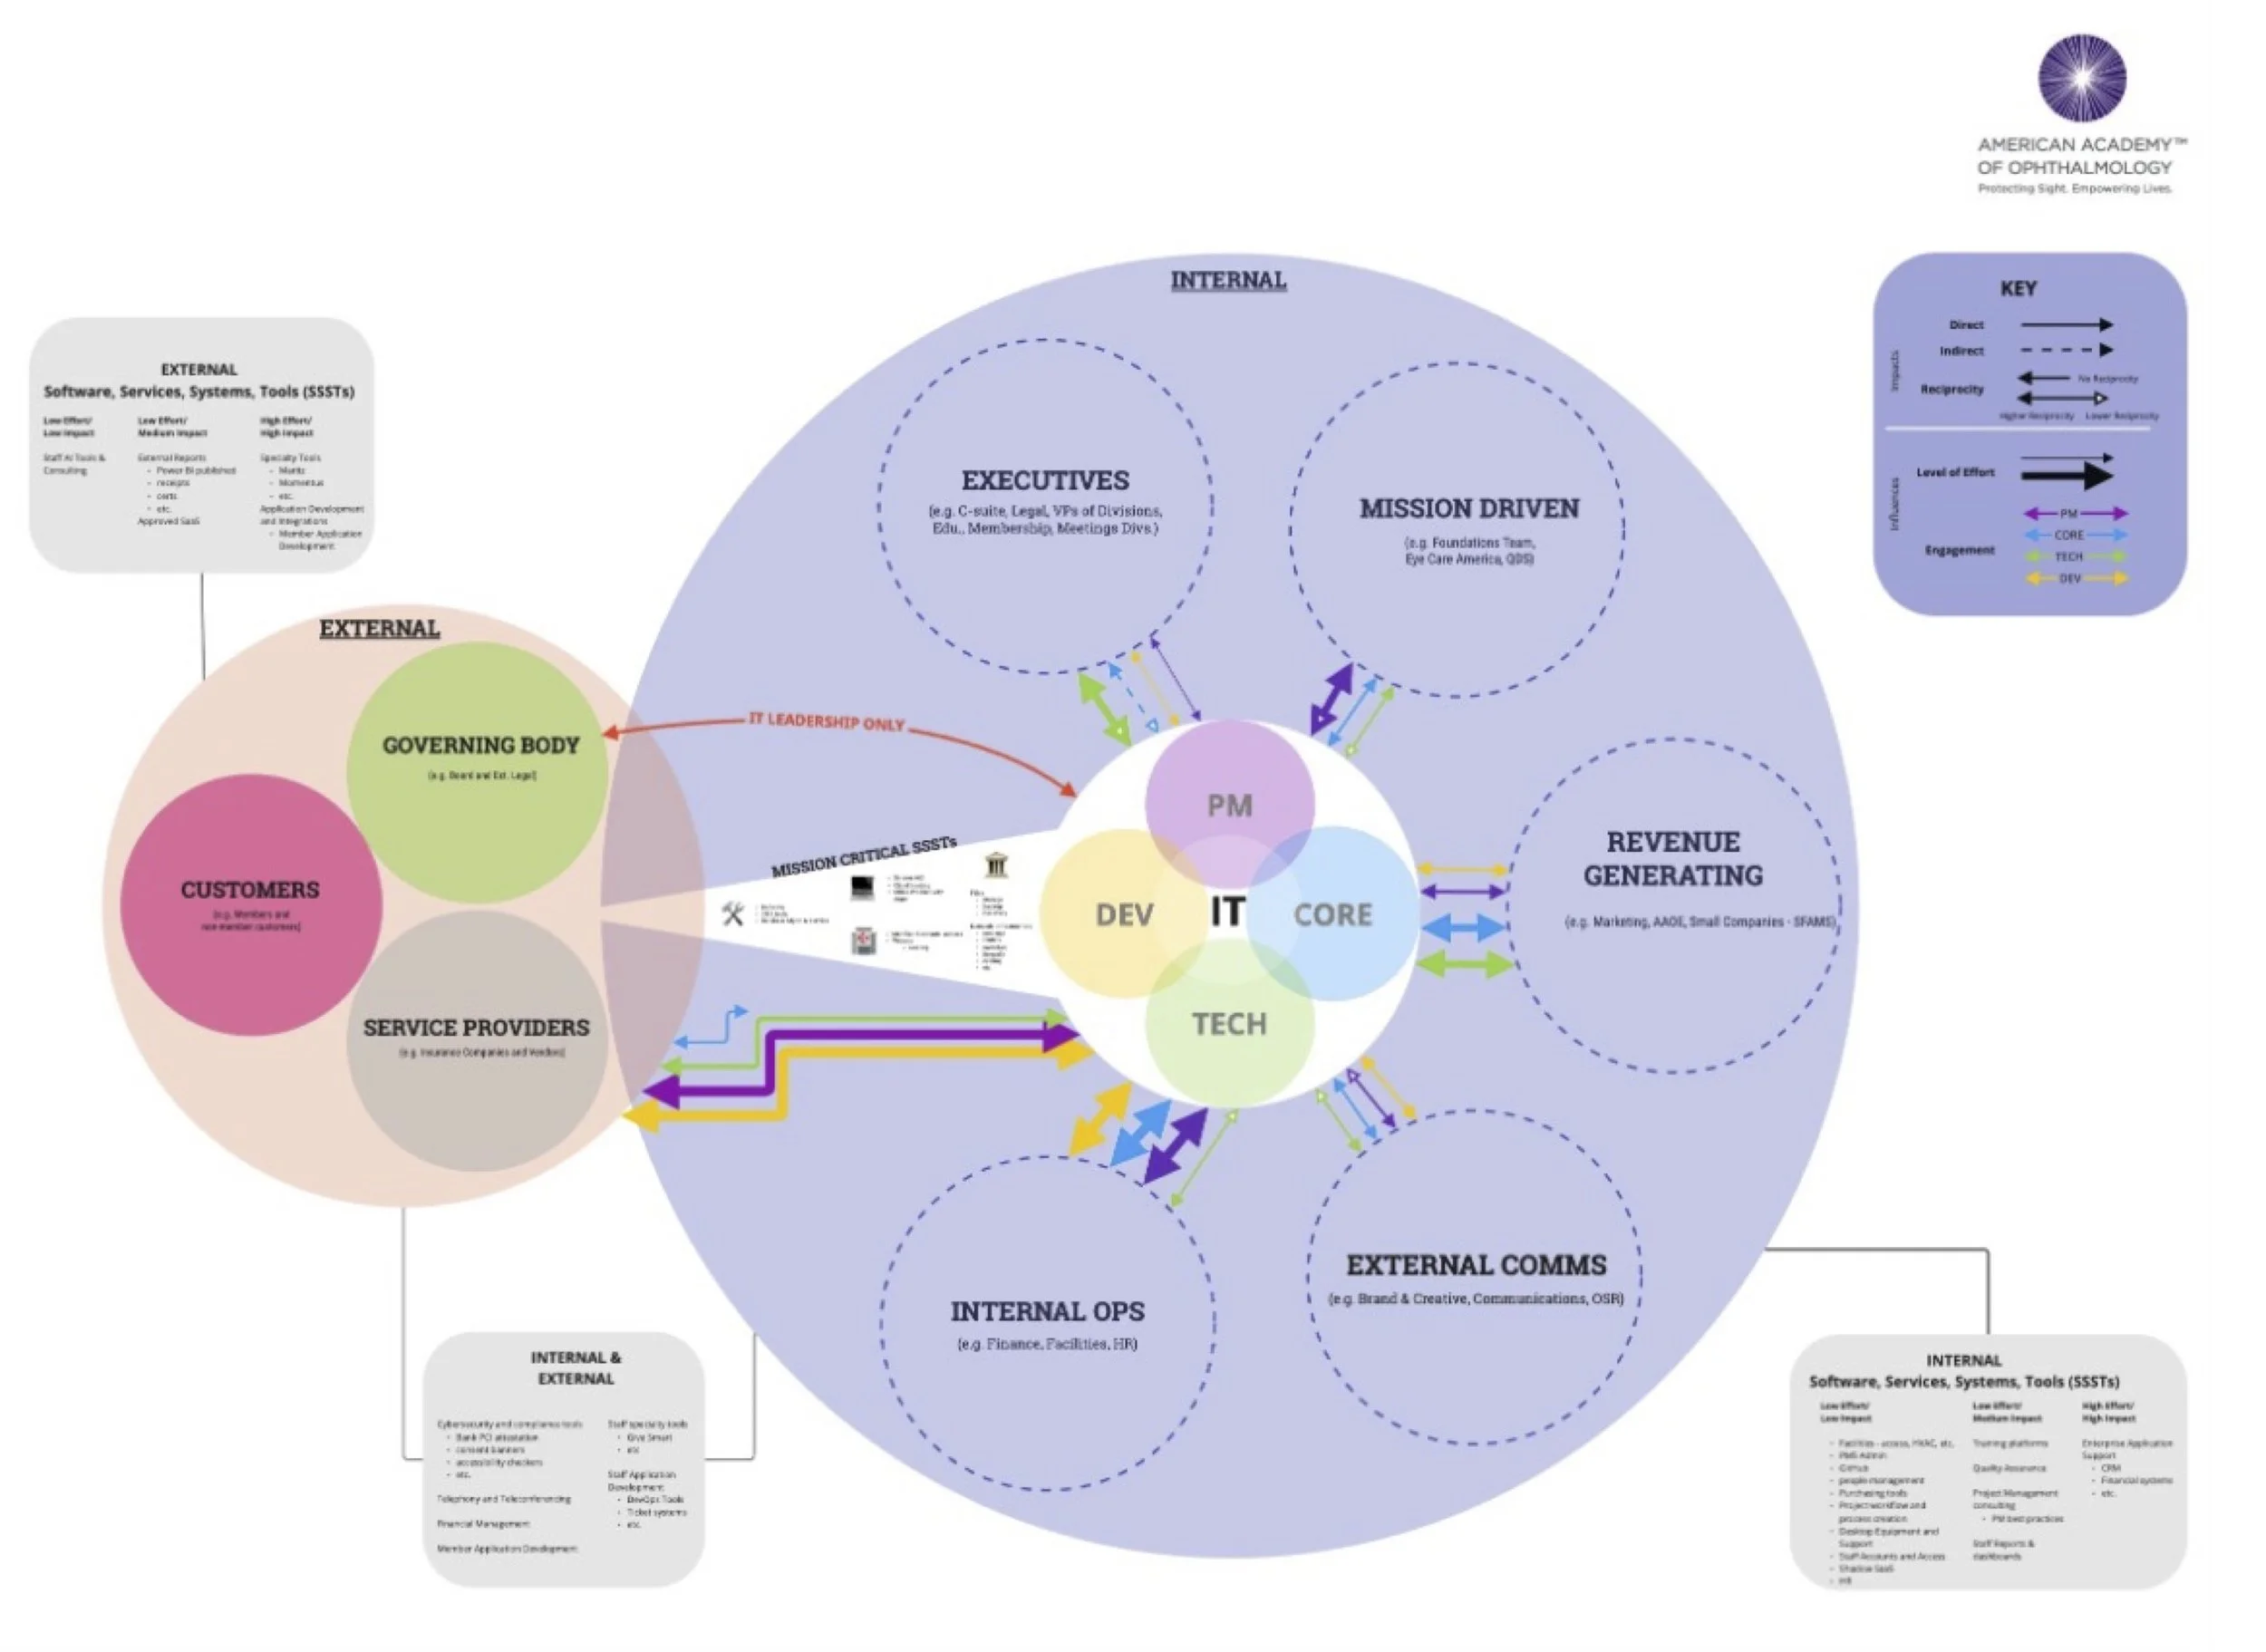
Ecosystem Map
Lini worked closely with the IT team to develop an "ecosystem map" layer by layer.
This visualization created immediate alignment among IT leaders regarding how their team was positioned within the broader organization.
Most importantly, it identified clear opportunities to build better, more collaborative relationships with internal stakeholders.
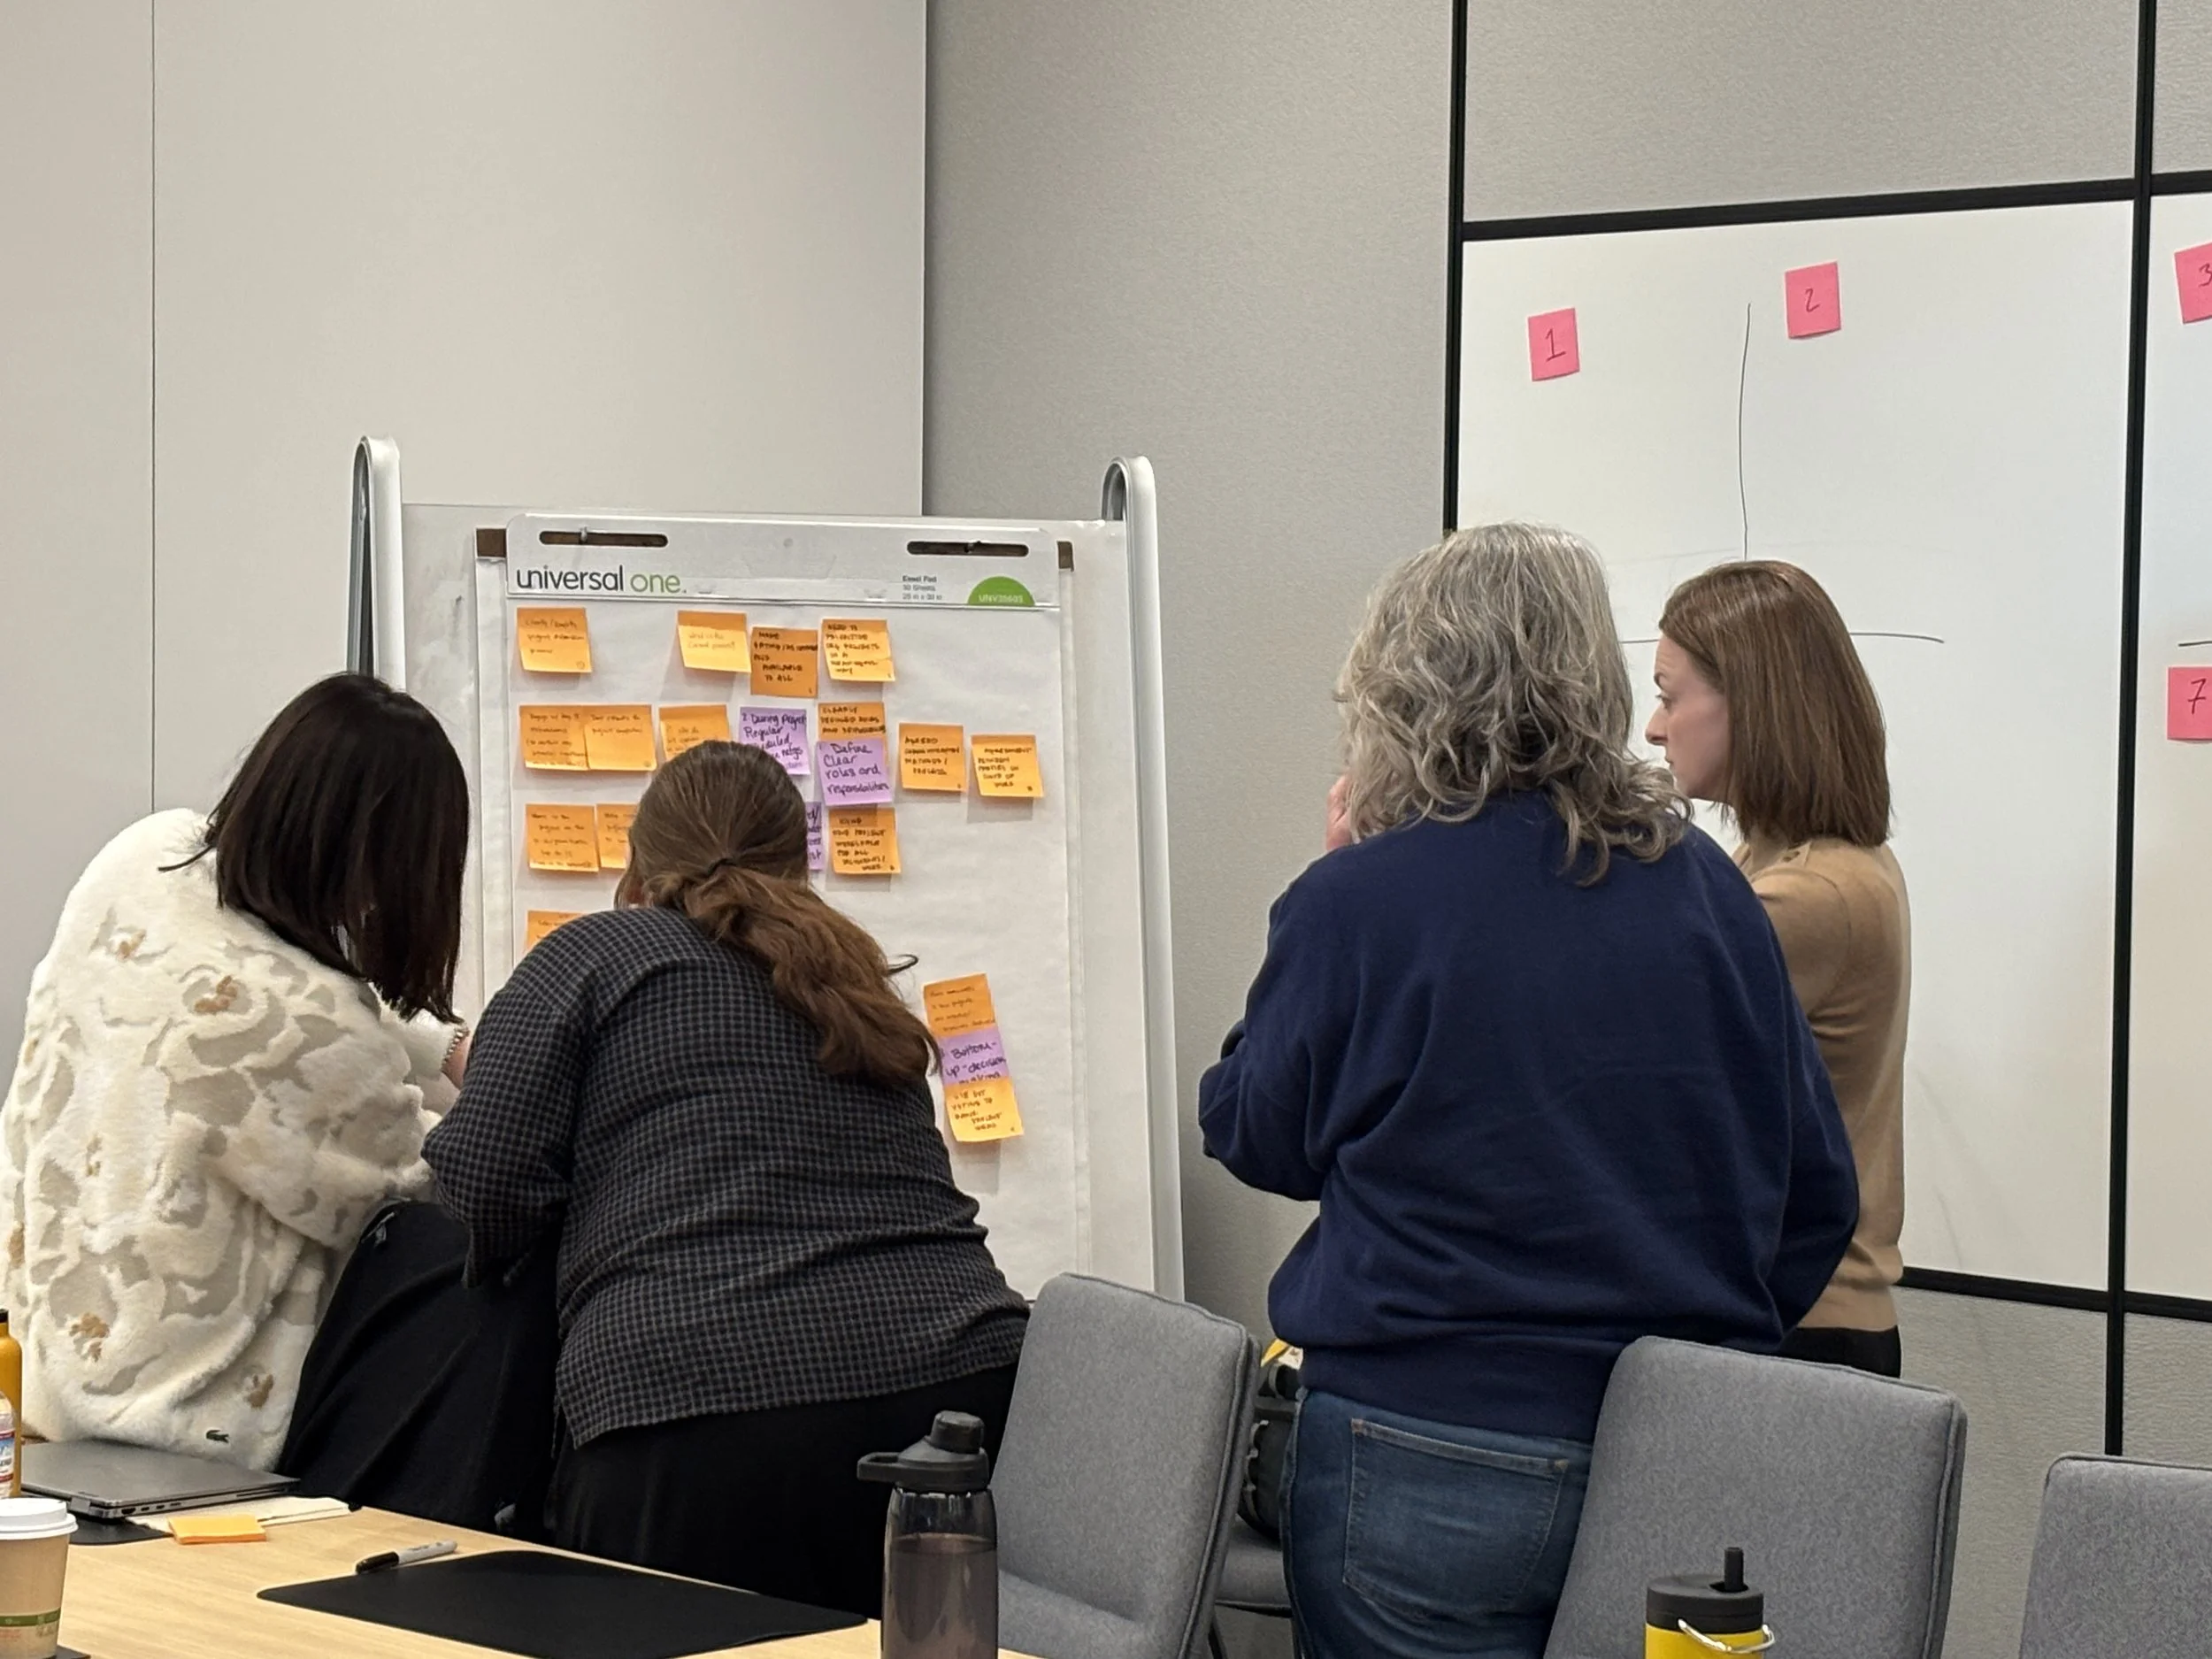
GENERATE Solutions: Stakeholder Collaboration
Through internal stakeholder interviews and a two-day facilitated workshop, participants came to a powerful collective realization: everyone at AAO was facing similar challenges. Rather than working in silos, our clients and stakeholders worked together to ideate and implement solutions. This unified, co-design approach emphasized the importance of collective action in driving meaningful, organization-wide change.
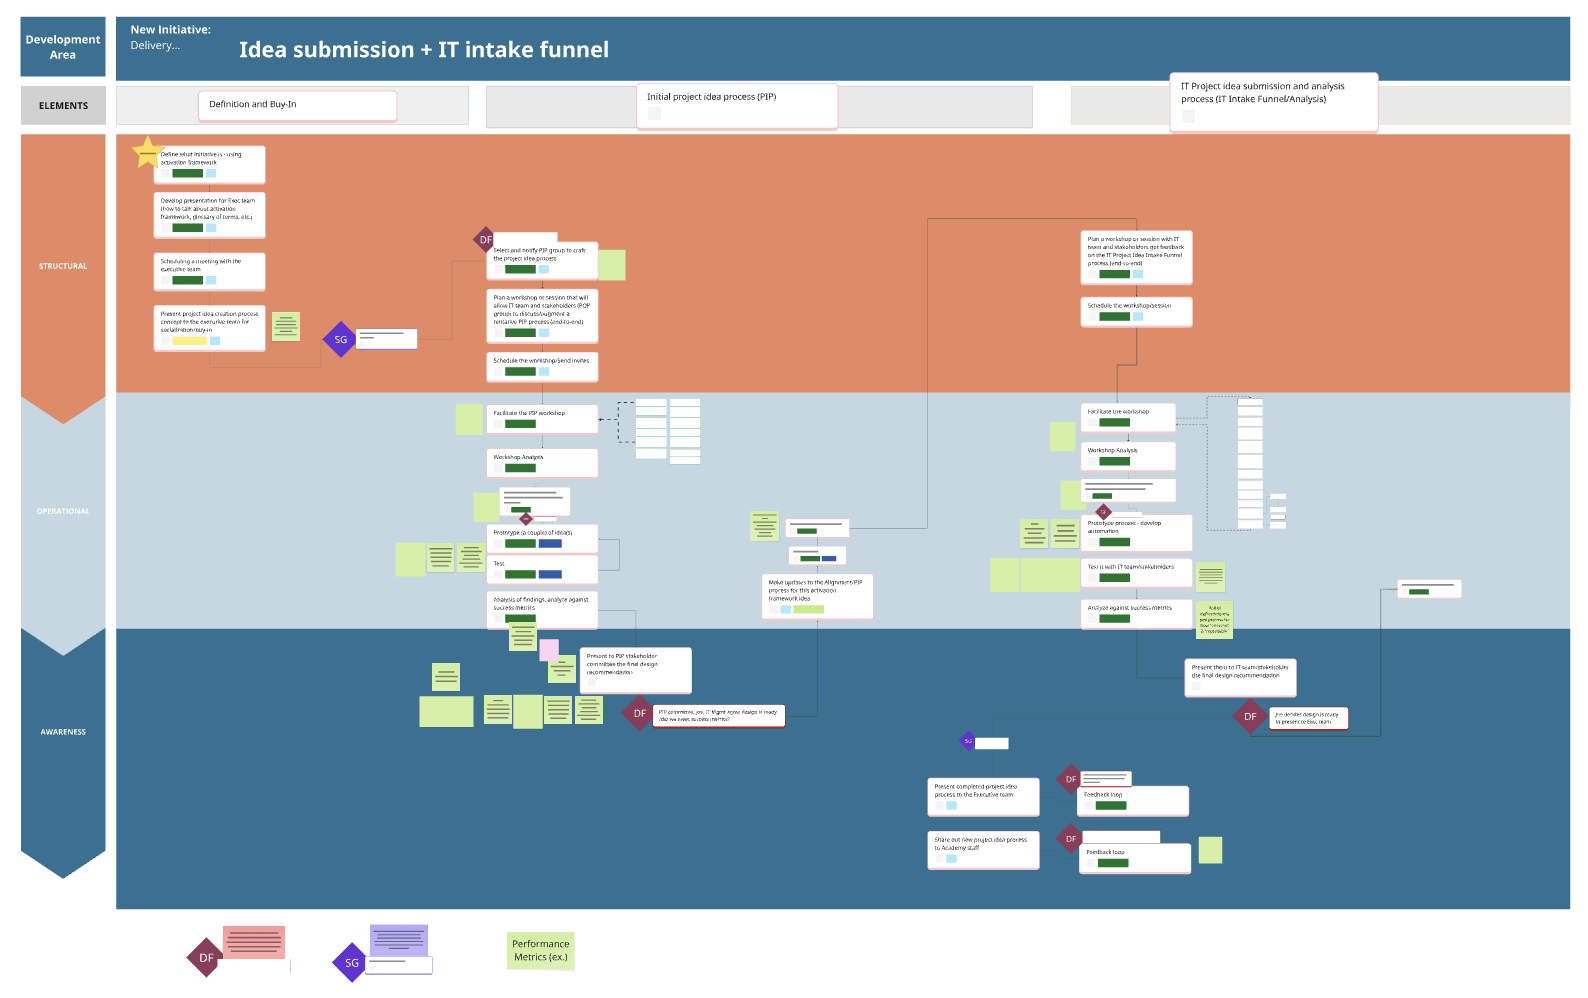
ACTIVATE Progress:
Implementation Planning
Drawing from the ecosystem map, research, and workshop outcomes, the IT team pinpointed their highest-impact initiative: co-designing an improved, transparent submission and IT intake process. They prioritized this as their primary example to develop into a robust activation plan, complete with clear scopes and measurable outcomes.
Impact +
Continued Success
By bridging the gap between IT and their stakeholders, by redesigning the intake funnel, the IT team successfully reduced process friction by ~25%.
Beyond the immediate process improvements, a key project outcome was empowering the IT team to independently manage future initiatives. To support this lasting capability, Lini provided the team with a comprehensive "Process Book" and reusable Miro activity boards. These assets not only highlighted the significant progress made but now serve as a permanent guide for recreating Lini's key frameworks moving forward. (Note: Process book redacted here for NDA purposes)
“Sylvia clearly understood our goals and developed a plan that put us on a path from where we were, to our ideal state. She is an experienced facilitator who not only helped us work through our process in a structured manner, but also taught us to do the same in the future.We are positioned not only to improve our processes continuously but also to help other divisions do the same. I would highly recommend Lini!”
— VP of IT - American Academy of Ophthalmology Are systemic issues causing friction in your organization?
Schedule a Free Consultation to see how Lini can support stakeholder alignment, and build team capabilities.